D.A. Forsyth --- 3310 Siebel Center
Trevor Walker --- 4207 Siebel Center
Office Hours Time: TBA, Location: TBA

Office Hours Time: TBA, Location: TBA
You should do this homework on your own -- one submission per student, and by submitting you are certifying the homework is your work.
Submission: Course submission policy is here
I strongly advise you use the R language for this homework (but word is out on Piazza that you could use Python; note I don't know if packages are available in Python). You will have a place to upload your code with the submission. BUT it's not required.
A famous collection of data on whether a patient has diabetes, known as the Pima Indians dataset, and originally owned by the National Institute of Diabetes and Digestive and Kidney Diseases can be found at Kaggle. Download this dataset from https://www.kaggle.com/kumargh/pimaindiansdiabetescsv. This data has a set of attributes of patients, and a categorical variable telling whether the patient is diabetic or not. For several attributes in this data set, a value of 0 may indicate a missing value of the variable. There are a total of 767 data-points.
svmlight (features, labels, pathsvm)
You don't need to understand much about SVM's to do this as we'll do that in following exercises. You should NOT substitute NA values for zeros for attributes 3, 4, 6, and 8. Compute an estimate of the accuracy of the classifier by averaging over 10 test-train splits. Each split should randomly assign 20% of the data to test, and the rest to train.Hint If you are having trouble invoking svmlight from within R Studio, make sure your svmlight executable directory is added to your system path. Here are some instructions about editing your system path on various operating systems: https://www.java.com/en/download/help/path.xml You would need to restart R Studio (or possibly restart your computer) afterwards for the change to take effect.
The MNIST dataset is a dataset of 60,000 training and 10,000 test examples of handwritten digits, originally constructed by Yann Lecun, Corinna Cortes, and Christopher J.C. Burges. It is very widely used to check simple methods. There are 10 classes in total ("0" to "9"). This dataset has been extensively studied, and there is a history of methods and feature construc- tions at https://en.wikipedia.org/wiki/MNIST_database and at the original site, http://yann.lecun.com/exdb/mnist/ . You should notice that the best methods perform extremely well.
You MUST use a version of the data we have set up as a Kaggle competition at https://www.kaggle.com/t/beaf4aad43984309aaa62e6674966205. We will use this version, with test-train splits that we have made. You can find this on the Kaggle competition page for this course, at https://www.kaggle.com/t/beaf4aad43984309aaa62e6674966205.
The dataset consists of 28 x 28 images. These were originally binary images, but appear to be grey level images as a result of some anti-aliasing. I will ignore mid grey pixels (there aren't many of them) and call dark pixels "ink pixels", and light pixels "paper pixels"; you can modify the data values with a threshold to specify the distinction, as described here https://en.wikipedia.org/wiki/Thresholding_(image_processing) . The digit has been centered in the image by centering the center of gravity of the image pixels, but as mentioned on the original site, this is probably not ideal. Here are some options for re-centering the digits that I will refer to in the exercises.
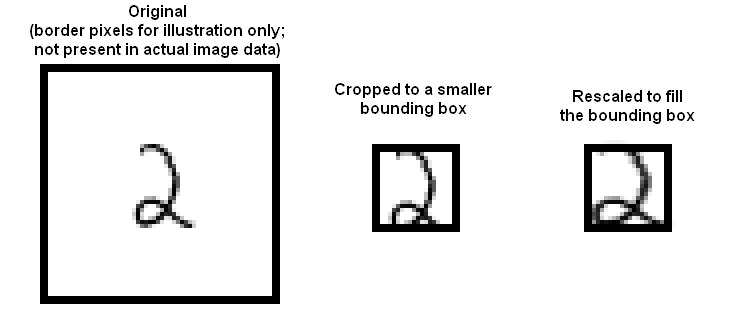
Investigate classifying MNIST using naive Bayes. Compute the accuracy values for the four combinations of Gaussian v. Bernoulli distributions and untouched images v. stretched bounding boxes. Please use 20 x 20 for your bounding box dimensions.
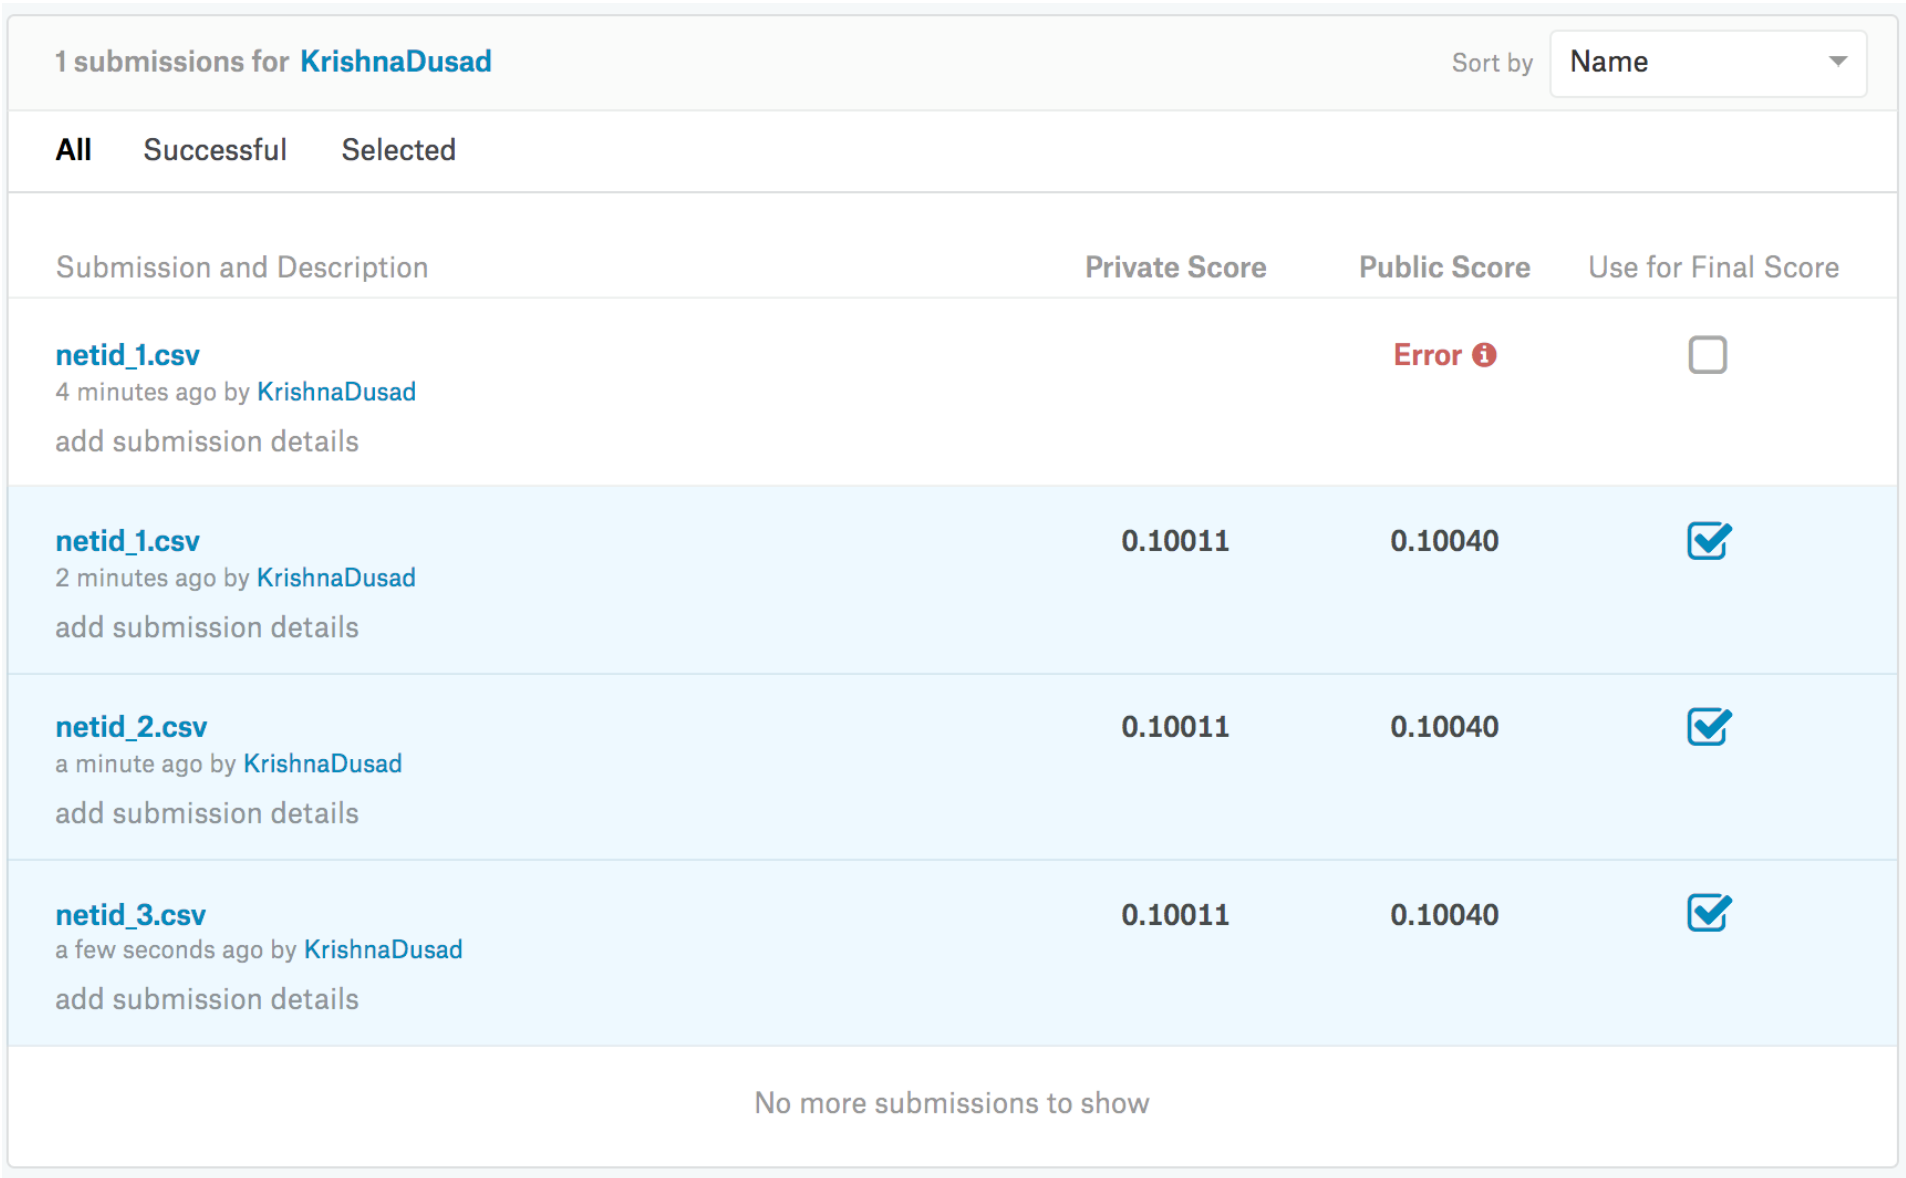
For part 1, you must submit a PDF file containing 3 numbers (the average accuracy over 10 folds for each part). For part 2, you will do two things. First, you will submit a screenshot showing your results for a private competition on Kaggle for each of the 12 cases (4 in A, 8 in B). These entries will be named "netid_x" for x 1:12. Each x should be as given in the table below.
| x | Method |
|---|---|
| 1 | Gaussian + untouched |
| 2 | Gaussian + stretched |
| 3 | Bernoulli + untouched |
| 4 | Bernoulli + stretched |
| 5 | 10 trees + 4 depth + untouched |
| 6 | 10 trees + 4 depth + stretched |
| 7 | 10 trees + 16 depth + untouched |
| 8 | 10 trees + 16 depth + stretched |
| 9 | 30 trees + 4 depth + untouched |
| 10 | 30 trees + 4 depth + stretched |
| 11 | 30 trees + 16 depth + untouched |
| 12 | 30 trees + 16 depth + stretched |
Second, you must submit a PDF file showing each submission value. Your file should also show, as images and all on a single page, the mean of the class distribution for each digit, for each of the four cases in 2A. This is a total of 40 digit images. The class means will be an image where each pixel is between 0 and 1. Please put all class means on a single page, four rows of 10 digits. You should use the convention that 1 is bright and 0 is dark.
Further Submission InstructionsWe will be using Gradescope (pdf submissions) and compass (code submissions) for all your homework submissions this semester.
Compass will be set up and it might take a couple of days that you will see the course online.
The homework deadline still remains the same. Submit the pdf on Gradescope by Monday.
HW1 codes is due as soon as the compass is set up (you will be notified when the course on the compass is online).
Submission on gradescope:
Course code: MWV5GB
Sign up on Gradescope ONLY by using your Illinois email. We will NOT grade submissions that come from other email ids.
Please follow the following format for submitting your pdf on Gradescope.
Submission on compass: Zip file containing all codes. README.txt file that explains how to run your code.